Data analysis with one click with the Power BI solution
Interpret your data better with the BI solution
Microsoft Power BI – data analysis made easy
Is analyzing business data one of your daily tasks? Then you know how much time and energy this process can take. Gathering information, making connections, and then drawing the right conclusion - it's easy to make a mistake or base the evaluation on incomplete data. This can have disastrous consequences for your company.
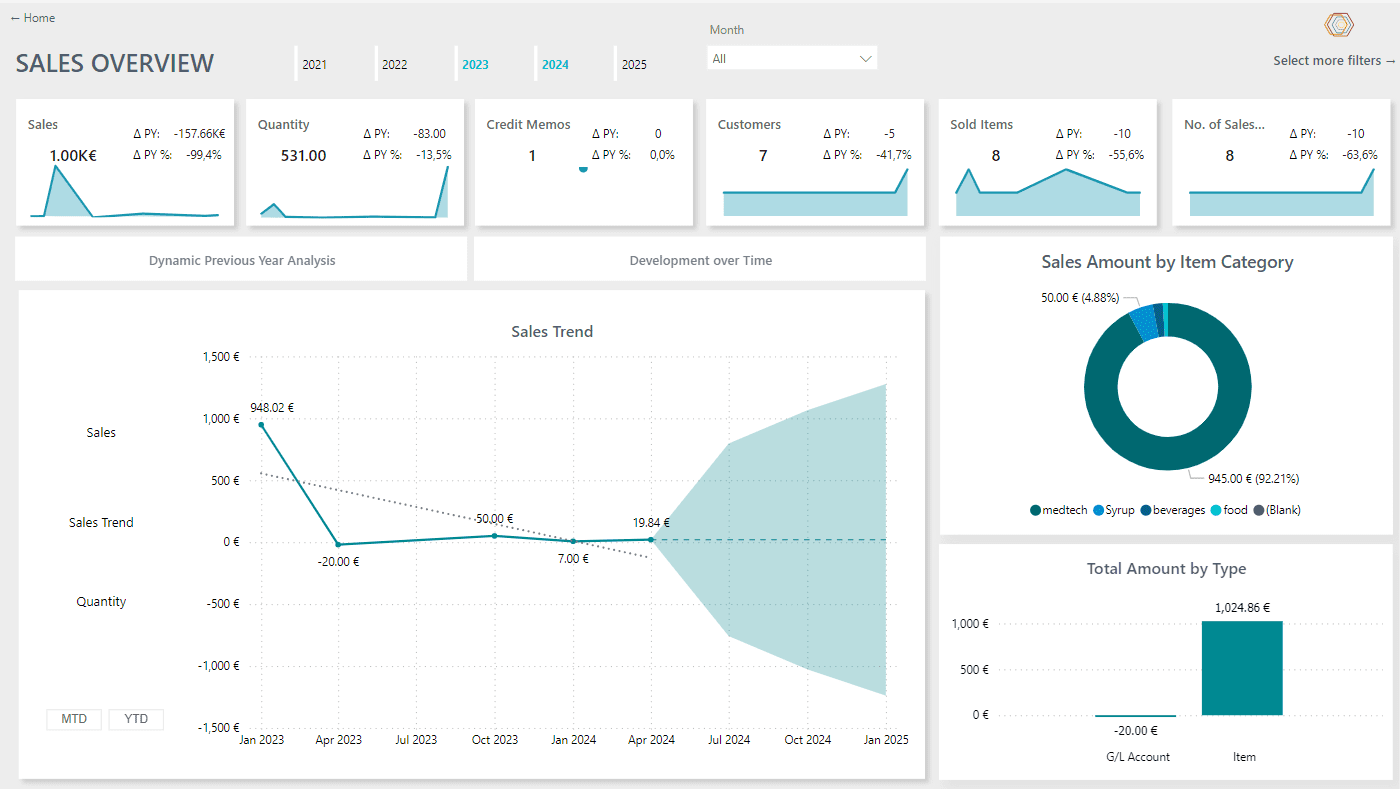
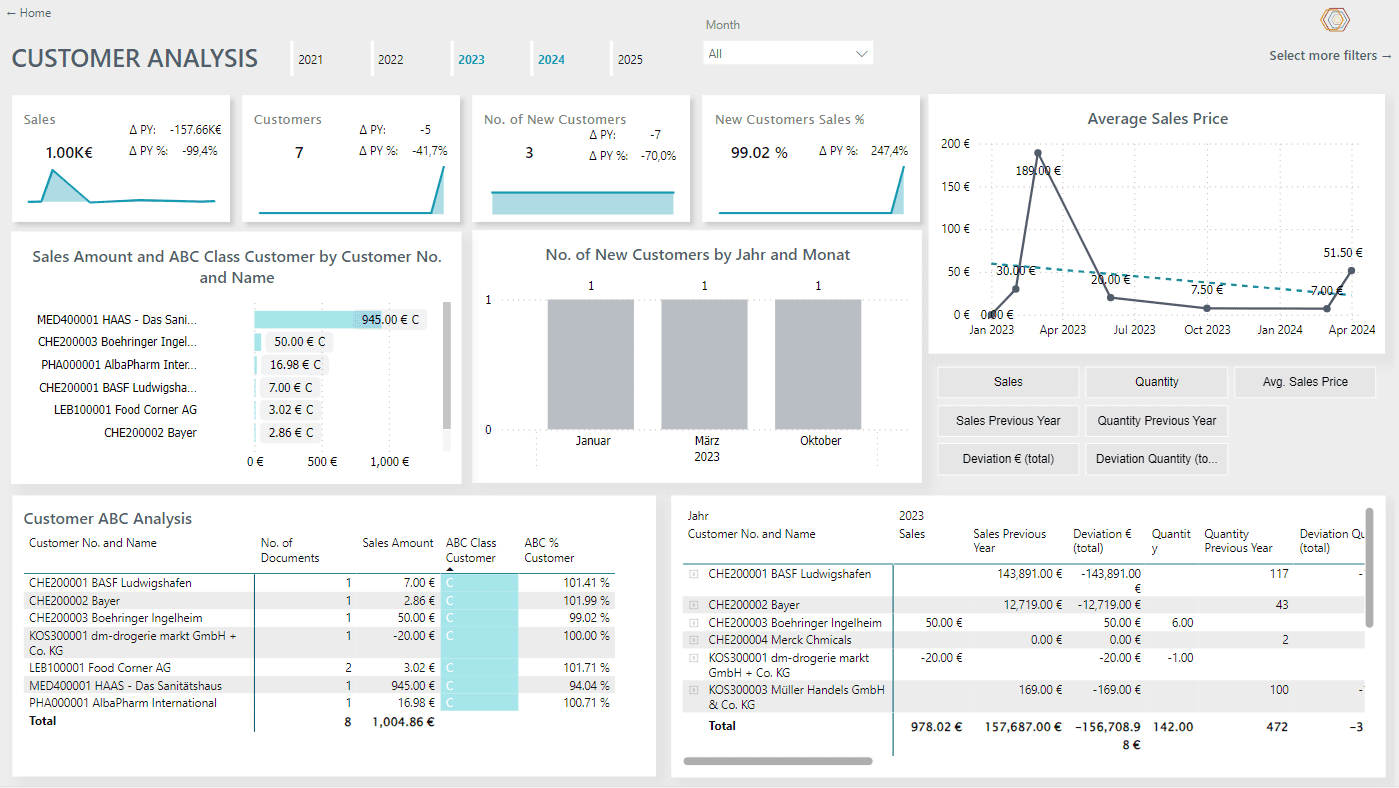
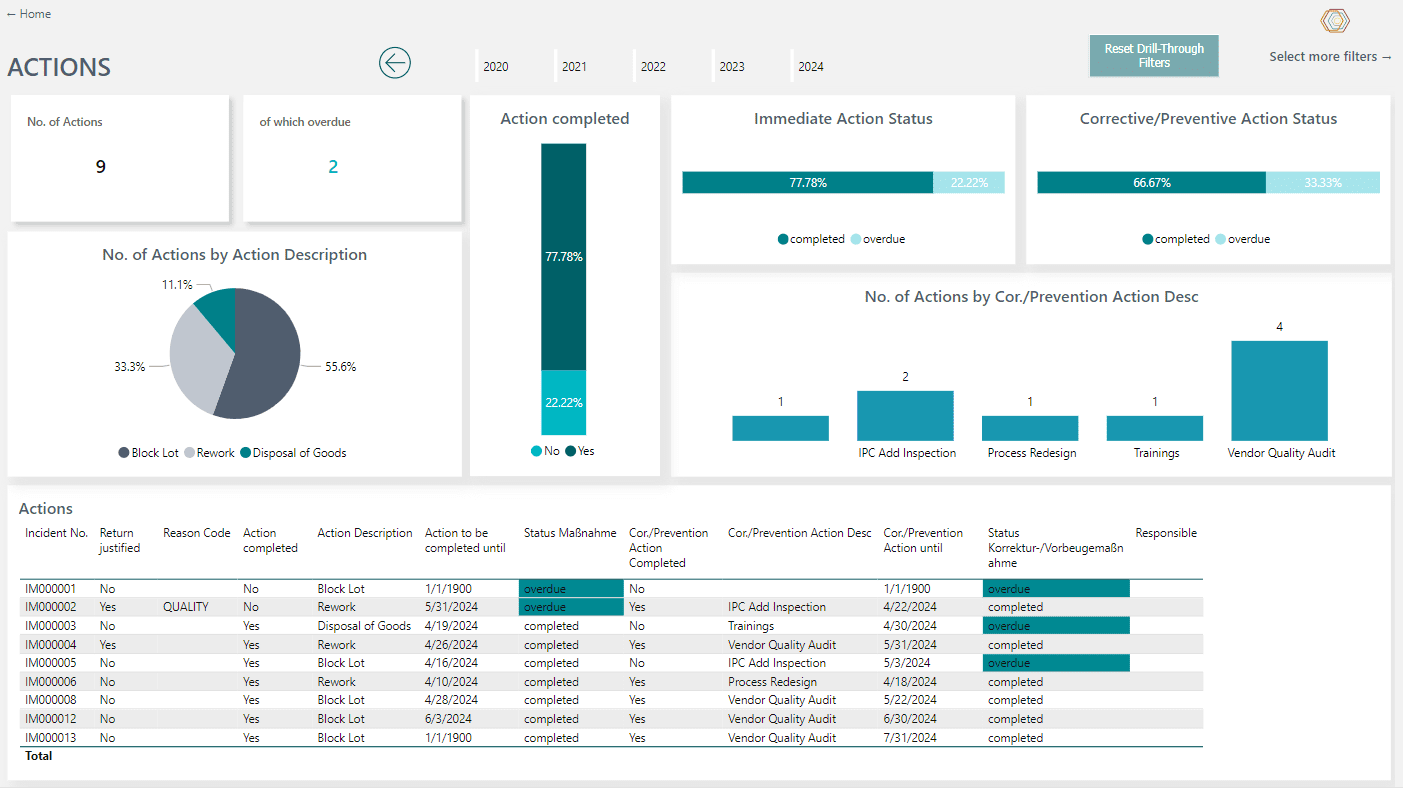
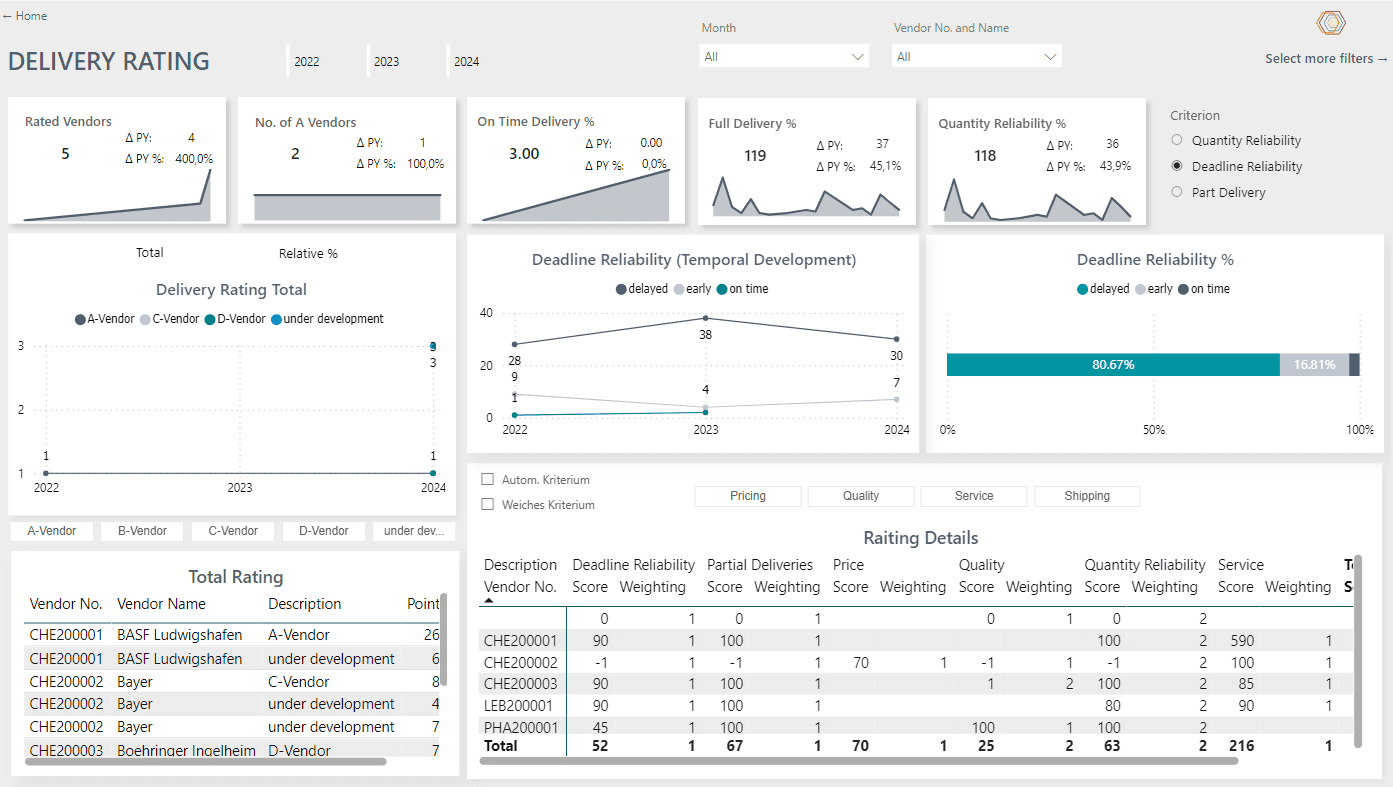
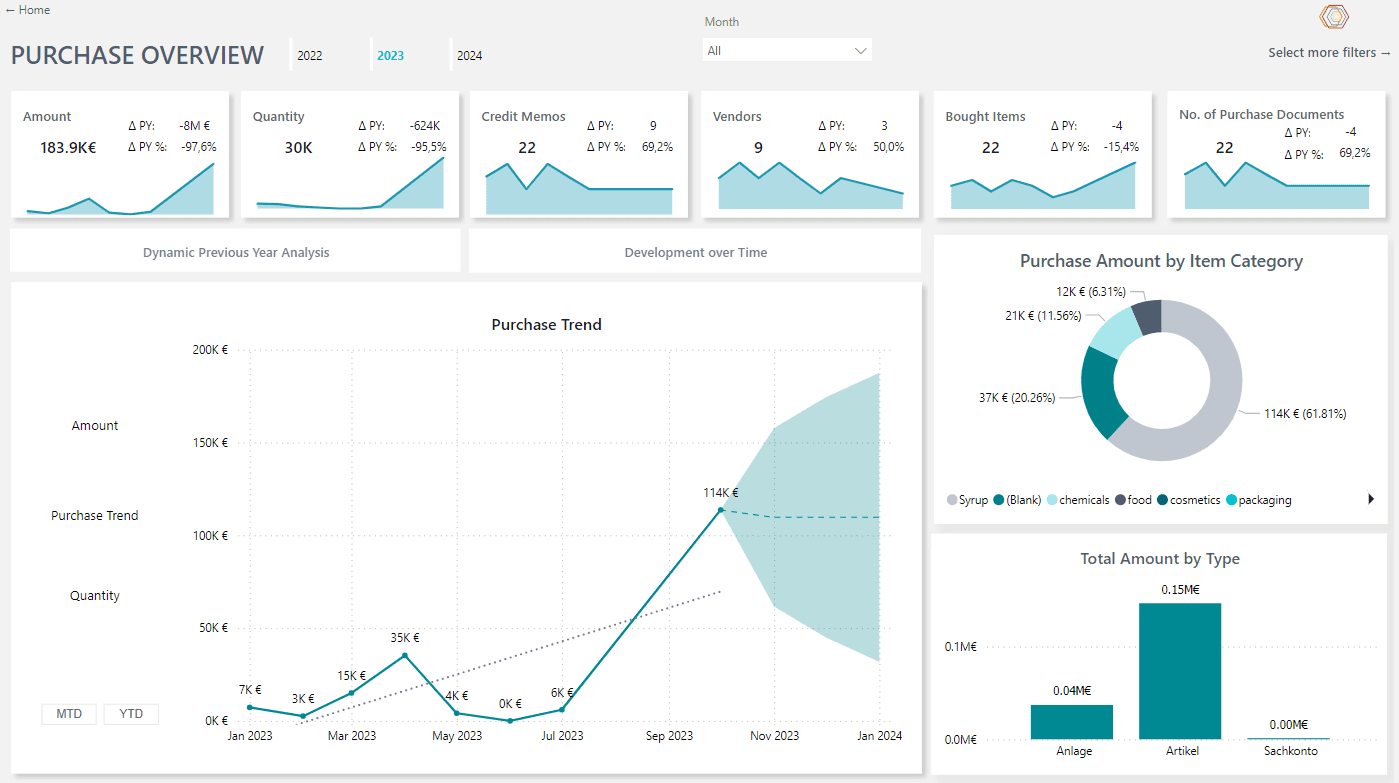
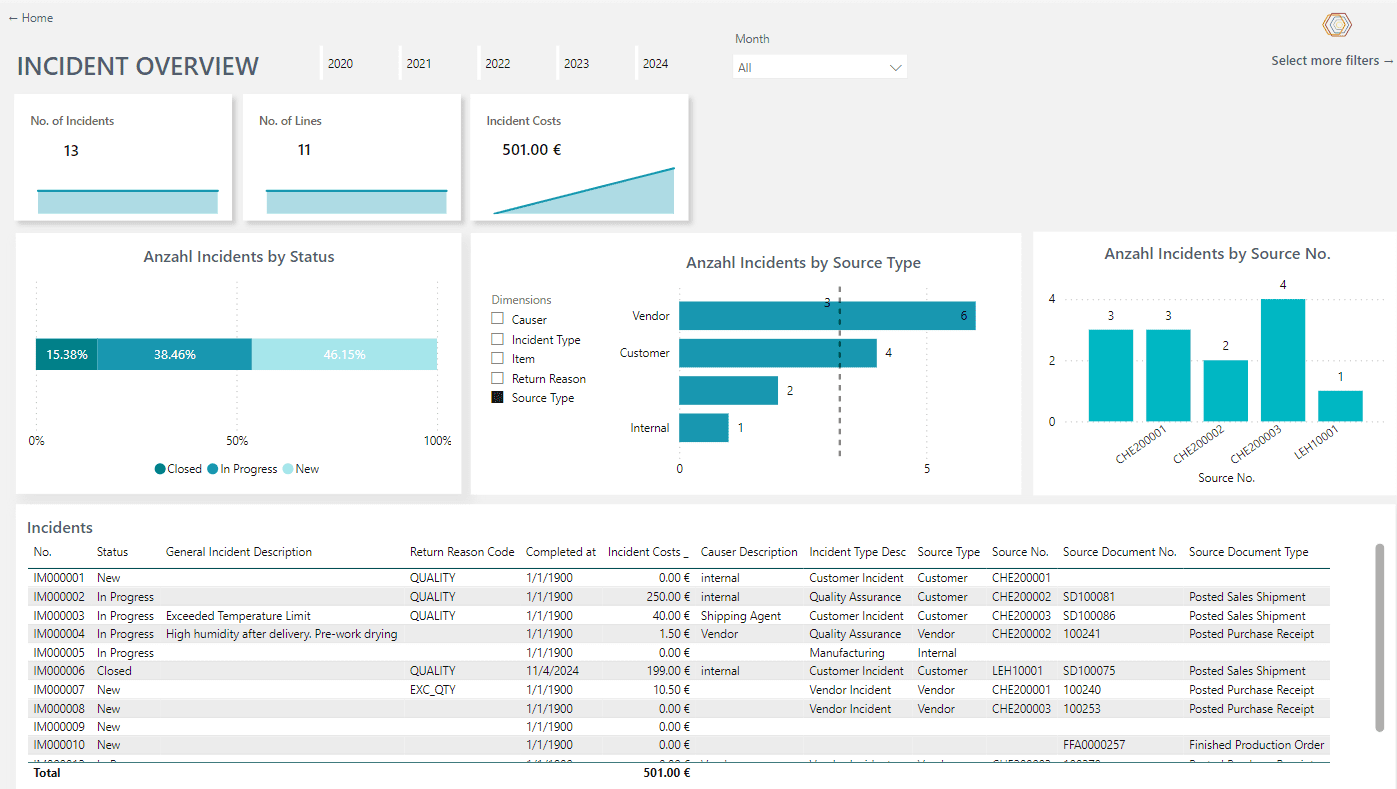
Do it better with Power BI - the data analysis tool from Microsoft. This Business Intelligence software accesses data from various sources using configurable connectors. Thanks to easily configurable Power BI templates, the tool establishes connections between data and displays analyses in an easy-to-understand and stylish design. Would you like to view reports and dashboards at a glance instead of doing complex analysis? Find out what Microsoft Power BI can do, and how YAVEON makes the solution even better.
Good to know: Microsoft Power BI has been recognized in the 2022 Magic Quadrant for Analytics and BI Platforms - for the 15th time in a row.
Microsoft Power BI – the key benefits:
Use even more extensively
BI Data Warehouse
Collect, unify and analyze complex and large amounts of data with BI Data Warehouse.
BI Cockpits
Data analysis based on targeted user groups thanks to templates fully integrated in Microsoft Power BI.
ProBI Connect
Export data quickly, directly and without code from Business Central - without additional effort.
Microsoft Power BI – the setup process
-
Step 1 Customize sourcesThe upstream systems from which your data is pulled are customized and connected to your BI system.
-
Step 2 Prepare dataNow it is a matter of bringing different files and formats into a uniform form. This step is performed by "ETL" - Extract, Transform, Load. A typical three-step process in the software industry.
-
Step 3 Collect dataA data warehouse is used to collect all your data and store it in one place, which you can implement separately or directly in Power BI. It is the core, where the evaluation of your data happens.
-
Step 4 AnalyzeNow it's time to filter and evaluate the significant information from your data. This is done by multidimensional analyses, "data mining," and it provides business-relevant data that you can use for evaluation.
-
Step 5 Make an evaluationYour data is now presented in the appropriate form, and you can evaluate it.
-
Step 6 Customize displayNumbers are good, graphics are better. That's why you use configurable Power BI dashboards or cockpits, such as the YAVEON Cockpits, to display your analyses clearly. For a particularly simple analysis, that is a pleasure to view.
One BI solution, three options: Use your system the way you want to use it
Microsoft Power BI service:
- For companies that want to create comprehensive and clear analyses
- Power BI cloud-based SaaS service - also referred to as Power BI Online
- Allows you to create and share analytics and reports via dashboards • Includes all available functions
- Includes all available functions
- Easy operation, fast results, better cooperation
Microsoft Power BI Desktop
- Desktop version of Microsoft Power BI
- Usable as a classic app on your computer
- Free version, with only basic functionalities
- Provides insight into the full range of functions
Microsoft Power BI Mobile
- Work on the go and access Microsoft Power BI from mobile devices
- Enables reports and content to be reviewed anywhere and accessed at any time
- App available in app stores
- For Windows, iOS, and Android devices
Bring your data to life with Microsoft Power BI and YAVEON
In our Microsoft Power BI Whitepaper, you will learn

Questions are there to be answered.
FAQs about Microsoft Power BI
In 3 steps to your individual
life presentation
Individual, non-binding & not complicated


